TL;DR: Investment research isn't about reading more — it's about building a repeatable process. This guide walks through a 5-step workflow used by professional analysts that you can apply with free or affordable tools, no Bloomberg Terminal required.
Most independent investors approach research the wrong way. They open ten browser tabs, read random articles, check Twitter, look at a chart, and somehow expect that pile of unstructured information to produce a smart decision.
Professional analysts work differently. They follow a process. Same questions, same order, same sources — every time. The process is what removes emotion and makes their decisions repeatable.
This guide shows you that process.
Why most retail investment research fails
Three patterns kill most retail research before it starts.
The first is starting from the chart. Looking at a price chart triggers anchoring bias instantly. You see a stock that "looks cheap" and now you're rationalizing reasons to buy it.
The second is reading commentary instead of data. A summary of an earnings call written by a journalist is not research. The actual transcript and the actual numbers are research.
The third is researching things you already believe. Most investors look for confirmation, not for the facts that would prove them wrong. Good research starts by trying to break your own thesis.

The 5-step investment research process
Step 1: Define what you actually want to know
Before opening a single tab, write down the question you're trying to answer. Not "is this stock good" — that's too vague. Something specific:
- Is the company's revenue growth sustainable for the next 12 months?
- Is the current valuation reasonable compared to peers?
- What would have to be true for this investment to fail?
A good question takes 30 seconds to write and saves you hours of unfocused reading.
Step 2: Read the primary sources first
The single highest-leverage habit in investment research is going to primary sources before reading any commentary about them.
For US stocks: SEC filings on EDGAR (10-K annual reports, 10-Q quarterly, 8-K material events).
For European stocks: company investor relations pages and ESMA filings.
For macro data: government statistics agencies (BLS, Eurostat, INE) — never a journalist's interpretation.
Reading the actual 10-K of a company you're researching takes 2-3 hours the first time. After that, you'll know things about the business that 95% of retail investors don't.
Step 3: Read what the company is saying right now
Quarterly earnings calls and press releases tell you what management is focused on this quarter. The tone, the language, what they emphasize, what they avoid — all of it matters.
Most investors read the headline number ("beat by $0.05") and stop. The signal is in the call transcript, not the press release.
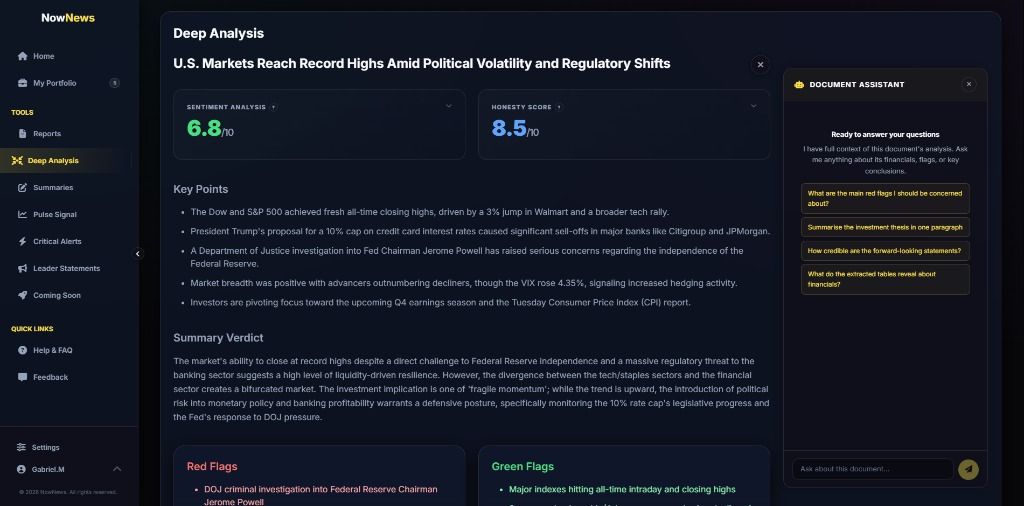
A tool like NowNews Deep Analysis can extract sentiment scoring and key points from earnings transcripts in seconds, which speeds up this step from 30 minutes to 5.
Step 4: Compare with peers
A company's metrics only mean something in context. Revenue growth of 12% sounds good — until you see competitors growing at 25%. A P/E of 18 looks reasonable — until you see the sector trades at 12.
Pick 3-5 direct competitors and pull the same metrics for all of them. This is where most retail research falls apart, because comparing companies systematically takes effort. But it's where the real insights live.
Step 5: Stress-test your conclusion
Before you commit, write down what would have to happen for you to be wrong. Not "the market crashes" — specific things:
- Margins compress by more than 200 basis points
- Customer concentration increases above 30%
- A new entrant captures 10% market share within two years
If any of those happen, you reverse your position. Writing this down before investing is what separates research from speculation.
Tools you actually need
You don't need a Bloomberg Terminal. Here's what professional independent analysts actually use:
| Need | Free option | Affordable option |
|---|---|---|
| Filings (US) | SEC EDGAR | EDGAR + alerts |
| Filings (EU) | Company IR pages | ESMA database |
| Financial data | Yahoo Finance, Stockanalysis | Koyfin, NowNews |
| News & sentiment | Reuters, FT free articles | NowNews Deep Analysis |
| Earnings transcripts | Seeking Alpha (free tier) | NowNews Deep Analysis, AlphaSense |
| Charts | TradingView | TradingView Pro |
The total cost of an independent research stack is around €30-50/month. A Bloomberg Terminal is €2,000/month. The gap isn't about features — it's about whether you need real-time execution and exclusive feeds (you probably don't).

How long should investment research take?
For a position you're considering for the first time: 4-8 hours of focused work, spread across 2-3 sessions. Less than that and you don't actually know what you own.
For a position you already hold and are reviewing: 30-60 minutes per quarter, after each earnings release.
For tracking your watchlist for ideas: 15 minutes per day, ideally at a fixed time, using a structured news source rather than scrolling random feeds.
A note on speed vs depth
There's always pressure to "act fast" on news. Resist it. The best returns in investing don't come from being the fastest — they come from being the most consistent. Five hours of structured research beats five hours of frantic scrolling every time.
If you want to build a more efficient research workflow, NowNews offers a 7-day free trial that includes news analysis, sentiment scoring, and earnings document analysis — the parts of the process that take the most manual time.
Last updated: April 2026.